The average number of days between customer orders serves as a direct indicator of customer loyalty. When this metric increases, it signals that customer loyalty is declining. This simple metric helps e-commerce businesses identify when they need to implement retention strategies or improve customer experience to maintain repeat purchase frequency.
Install our extension to search inside any video instantly.
The Metrics Your Dashboard Isn't Showing You #ai #shopifyIndexed:
Most ecommerce owners track the obvious stuff — revenue, ROAS, conversion rate. But the numbers that actually kill stores? Nobody talks about them. In this video, I break down 3 hidden metrics AI surfaces in seconds — plus the one gap that signals your store is bleeding out in slow motion. If you're running an ecommerce store and making decisions without these numbers, you're flying blind. 🔗 Run AI on your own store data → https://www.skool.com/data-uncovered-4712/about 📊 Follow for more hidden signals in your business data. #ecommerce #dtc #shopify #ecommercestore #onlinestore
Three numbers. Most e-commerce owners have no idea what they are until their store is already in trouble. First, refund rate by product. Not your overall refund rate, by product. One SKU can quietly destroy your margin for months.
Second, customer acquisition cost trend.
Not the number, the trend. If it's creeping up week over week, your ads are dying and you don't know it yet. Third, days between orders. If this number goes up, loyalty is going down. Simple as that. AI surfaces all three in seconds.
Follow to see exactly how.
Related Videos

BITCOIN BREAKS $80,000! The Next Stop is $100K? - Matt Hougan
digitalcoin622
195 views•2026-05-15

Brooklyn Nets Draft Talk + Future of the Franchise | Inside the NBA Agency World ft. BJ Bass
TheBrooklyn_Boys
679 views•2026-05-17
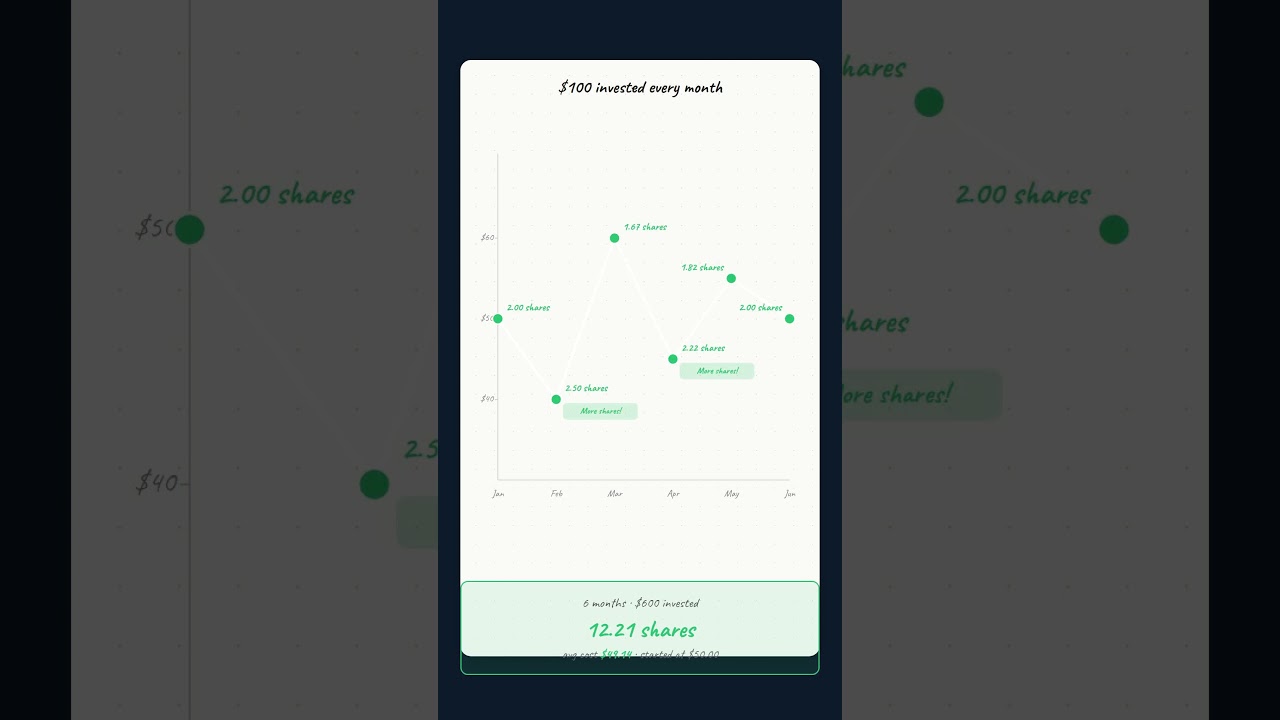
What Is Dollar-Cost Averaging? (Why Monthly Investing Beats Timing)
DailyMoneyBasics
173 views•2026-05-19

Are Expensive Dive Watches Actually Better?
HarrisonElmore
12K views•2026-05-20

Business studies
mastersbusinessclass
508 views•2026-05-19

Disney Lorcana’s biggest PROBLEM benefits YOU (The Collector)
1stClassCollection
170 views•2026-05-19
Mukka Proteins FY26 Results: Revenue Jumps 44%, Margin Expansion Continues #q4fy26results #q4fy26
NiftyBN
171 views•2026-05-17

With high diesel prices, local food trucks finding ways to adjust
ABC30ActionNews
304 views•2026-05-18


